Observability

What the heck is Observability? Another buzzword?
Yes, it is, but for a reason. Let me explain.
It was reintroduced to IT by by Twitter and popularized by companies like Honeycomb, Splunk, NewRelic, etc.
Quoting Honeycomb’s CTO, observability is:
…a measure of how well internal states of a system can be inferred from knowledge of its external outputs.
Partially, this can be achieved through proper logging and monitoring, but observability encompasses more. It requires a distinctive term to truly resonate with us.
Observability transcends code or infrastructure; it’s about engineering culture and people. After all, only humans can derive meaning from numbers, log messages, and so on.
Complex systems fail in complex ways, and as time passes, cognitive complexity (especially the incidental one) only increases. Our services need to have good observability from the ground up to keep up with these disordering processes.
The North Star
To outline the culture we aim to foster, here is a list of traits demonstrated by teams that have embraced a high level of observability:
Every team has:
- A place reflecting the current state of all systems within their ownership.
- Ample logs, traces, and context to identify the cause of an issue without the need for extensive debugging or code interference.
- Automated alerts covering a wide array of symptoms are looked after.
- A dedicated forum for decision-making, sharing status updates, and requesting urgent assistance.
- Well-established incident and post-incident processes that are adhered to.
- An established escalation path to signal major disruptions and anomalies to stakeholders, clients, or the broader organization.
In Particular
The following practices contribute to achieving good observability, some of which are considered pillars.
- General Principles
- Metrics
- Logging
- Tracing
- Monitoring
- Alerting
- Service Levels
1. General Principles 1
- Generate unique request/correlation/tracecontext IDs at the edge of your infrastructure and propagate them through the entire request lifecycle;
- Create at least one event per service/hop/call/etc;
- Wrap any call out to any other service/data-store/dependency as a timing event and incrementing counter;
- Collect and store lots of additional context; Opt for broader events (with more fields) when you can;
- Don’t hesitate to add fields that only exist in specific contexts;
- Be mindful of field names, like field name prefixes or adding units to field names (such as
parsing_duration_μsorfile_size_gb). - You name it…
2. Metrics2
Metrics provide a numerical representation of data captured over a set period, e.g., counters, durations, histograms.
USE
Utilization - Percent time a resource is busy, such as node CPU usage;
Saturation - Workload a resource faces, often expressed as queue length or node load;
Errors - Count of error events.
- The USE method focuses on its internal state;
- USE can point on causes of issues;
- Good for services that don’t have synchronous APIs, infra or platform services.
RED
Rate - Requests per second;
Errors - Number of requests that are failing;
Duration - Amount of time these requests take, distribution of latency measurements.
- The RED method tells you how happy your clients are;
- RED is more likely to report symptoms of problems;
- Good for services with the client-facing experience.
The Four Golden Signals 3
Google recommends this set of four “golden signals” to monitor a user-facing system:
Latency — The time it takes to service a request;
Traffic — A measure of how much demand is being placed on your system, measured in a high-level system-specific metric;
Errors — The rate of requests that fail, either explicitly or implicitly;
Saturation — How “full” your service is.
- These signals can be a compromise between RED and USE.
- There are existing implementations out there.
- Good input for the initial team’s SLOs.
3. Logging
A log entry is a timestamped record of an event, often containing additional information implicitly or explicitly captured during its creation.
Creating enough logs for the key events is an excellent way to help the future us faster and more effectively identify causes, see trends, and perform analysis. More is better than less (as it’s irreversible), but it’s crucial to filter out irrelevant noise.
- Use the Log levels (e.g. FATAL, ERROR, WARN, INFO, and DEBUG).
- Employ unique identifiers.
- Craft meaningful log messages for discoverability and actionability.
- Include sufficient context: environment, input/output, callee and caller, etc.
- Record the state of business processes.
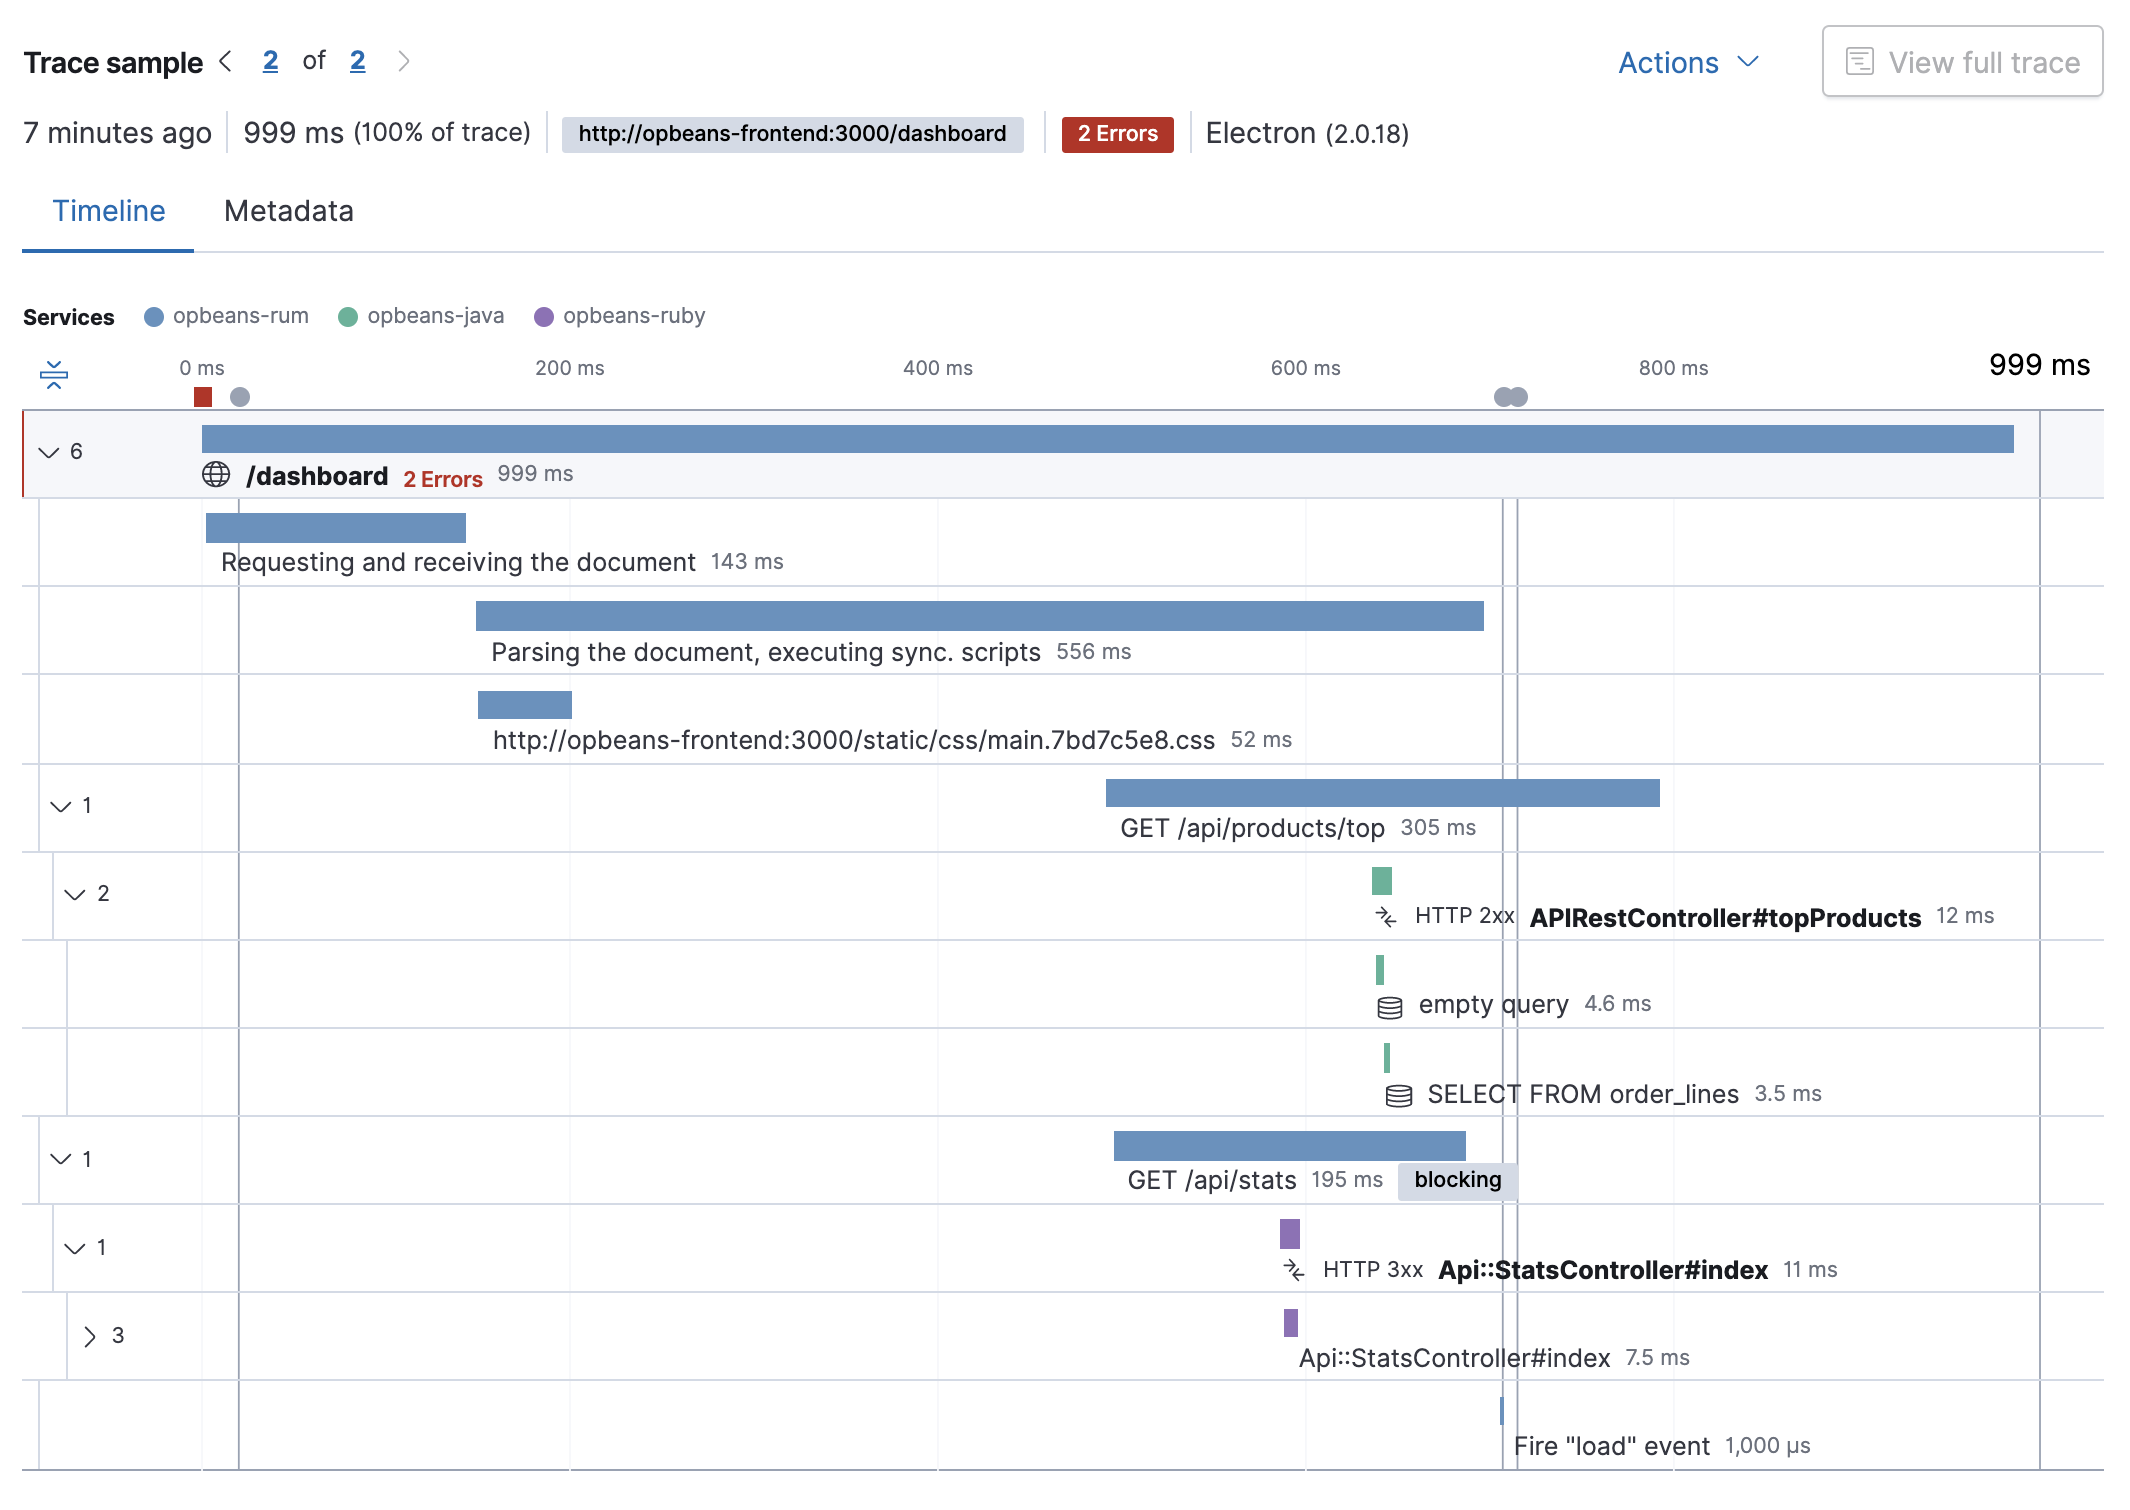
4. Tracing 4
Tracing is observing key events happening along the entire request lifecycle.
Distributed Tracing — is a method for observing requests originating in distributed environments.
Some tools and terms:
OpenTracingOpenTelemetry,- W3C Trace Context
5. Monitoring 5
Monitoring involves collecting, processing, aggregating, and displaying real-time and historical quantitative data about a system, such as query counts, error counts, processing times, etc.
Dashboard software (such as Grafana) is typically used for monitoring, though the specifics may vary based on the observation stage.
- When uncertain or starting from scratch, prioritize symptoms over causes. For instance, focus on the age of the oldest message in the queue rather than the message count.
- Dashboards should be always accessible and self-discoverable.
- Effective teams monitor their SLOs and define at least self-imposed SLAs to maintain a balance between over-engineering and accruing technical debt.
- For a quick sanity check, imagine having only 10 minutes to identify the approximate cause of a problem.
- Unlike logging, monitoring can surface a comprehensive picture of multiple inputs for just-in-time analysis.
6. Alerting 6
A notification intended to be read and acted upon by a human and that is pushed to a system such as a bug or ticket queue, an email/slack message, or a pager.
Alerts that are triggered by the risk of an SLA breach tend to start an incident. Be cautious of alert fatigue and keep them relevant and self-descriptive. These tips should help avoid it.
- Each time an alert triggers, it should demand a sense of urgency. (We can only react with a sense of urgency a few times a day before becoming fatigued).
- The absolute majority of alert triggers need to be automated.
- Every page should be actionable.
- Every page response should require intelligence. If a page merely merits a robotic response, it shouldn’t be a page.
- Pages should address novel problems or previously unseen events.
- Establish and adhere to protocols for alert responses, runbooks, and a registry of triggered alerts.
7. Service Levels
Integrating Service Level Objectives (SLOs) and Service Level Indicators (SLIs) into observability improves system management by setting performance targets and measuring against them.
- Even self-imposed SLOs can help establish a service’s expected reliability and responsiveness, providing a quantifiable target for its delivery. SLIs are the metrics that measure this performance, including data points such as latency, uptime, error rates, and throughput.
- This approach shifts systems management from reactive to proactive, allowing teams to anticipate and mitigate issues, like downstream dependencies being unavailable before they impact users.
- It also helps to prioritize efforts, improve the end-user experience by meeting reliability targets, and facilitate data-driven decisions that align technical performance with business goals, driving operational excellence. For example, can we promise 9.99 availability when our subsystem doesn’t deliver more than 9.9?